Graph Writing Vocabulary Index:
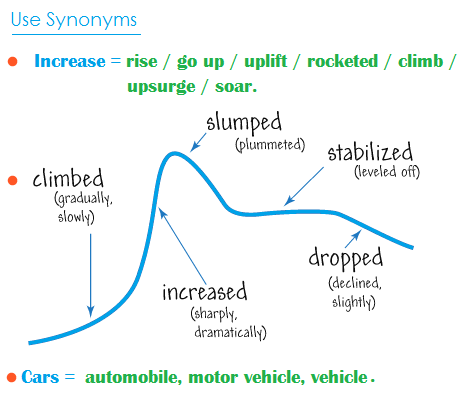
Everybody uses some common vocabularies to describe a diagram and to write a report. For instance, there would be hardly anyone who does not use the words 'increase, decrease, fall, higher, fluctuate, climb, decline, quickly increase, sharply decrease, and those are really obvious words used by most of the IETLS candidates. If you too use these overused words and phrases, you would not be able to give an impression that your range of vocabulary is stronger and richer than others. This article "Vocabulary For Academic IELTS Writing Task 1 (part 5)" solely focuses on introducing you to a nice set of words and vocabulary that you can use in your Academic IELTS Task 1 to achieve a high band score:
» Illustration: can replace - "diagram, chart."
» As the diagrams suggest: can replace - "As can be seen, According to the diagrams.
» Illustrate: can replace - "describe, show, present data on."
» Trifling: can replace - "small, insignificant."
» Delineate: can replace - "show, present, describe."
» From this graph, it is quite evident that: can replace - "In conclusion, In summary, In general."
» The most possible ground: can replace - "the most common reason."
» Elaborate: can replace - "describe, explain."
» Nadir: can replace - "the lowest point."
» Apex/ Vertex: can replace - "the highest point."
» Soared: can replace - " sharply increased."
» Skyrocketed: can replace - " very quickly increased.
» Frantically: can replace - "very quickly, very rapidly."
» Slumped: can replace - "quickly dropped."
» Plummeted: can replace - "quickly dropped."
» Surged: can replace - "went up, climbed, increased."
» Deteriorate: can replace - "fall."
» Dip: can replace - "fall, decline."
» Dive: can replace - "fall, drop."
» Go into free-fall: can replace - "fall, drop, decline, decrease."
» Plummet, plunge, slum: can replace - "fall, drop, decline."
» Take a nosedive: can replace - "reduce, drop, fall, decline."
» Slide: can replace - "drop, fall."
» Decade: can replace - "ten years."
» Projected: can replace - "predicted, forecasted, estimated."
» Overwhelmingly: can replace - "greatly, significantly."
» Hardly: can replace - "barely, merely,
» At the onset it is clear: can replace - "As can be seen from the graph."
» Indicate: can replace - "point out."
» All in all: can replace - "In summary, in conclusion."
» Obtain: can replace - "get."
» Commence: can replace - "start".
» In the interim: can replace - "in the meantime."
» Correct: can replace - "right".
» Inexpensive: can replace - "cheap."
» Depict: can replace - "show."
» Plateaued: can replace - "remained the same."
» Oscillate/ Vacillate/ Palpipate: can replace - "fluctuate."
» Declivity: can replace - "drop, fall, decrease".
» Acclivity: can replace - "An upward slope, an upward trend, increase."
» A steep fall: can replace - "A quick fall".
Vocabulary to ensure high band score in IELTS Graph writing:
Few more useful vocabulary to ensure high band score in IELTS Graph writing:
- Plateau
Meaning: Reach a state of little or no change after a period of activity or progress, levelled out.
Example: The share price of the ACME company have plateaued out.
Example: The share price of the ACME company have plateaued out.
- Dip
Meaning: Submerge, lower plunge, sink.
Example: The employee satisfaction score then dipped in 2005 and remained at this level for the next three years.
Example: The employee satisfaction score then dipped in 2005 and remained at this level for the next three years.
- Slump
Meaning: Decrease, decline, deteriorate.
Example: The number of passengers then slumped and reached to only 2500 compared to four thousand in the previous year.
Example: The number of passengers then slumped and reached to only 2500 compared to four thousand in the previous year.
- Steep
Meaning: Sheer, sharp, abrupt, perpendicular.
Example: The steep decline of the heavy drinkers contributed to the enhanced life expectancy in this country.
Example: The steep decline of the heavy drinkers contributed to the enhanced life expectancy in this country.
- Substantial
Meaning: Notable, considerable, significant, marked
Example: A substantial number of these diploma holders did not finish their tertiary education.
Example: A substantial number of these diploma holders did not finish their tertiary education.
- Dramatic
Meaning: Significant, notable, noteworthy, remarkable, considerable, substantial.
Example: The dramatic rise of the car use has polluted the air.
Example: The dramatic rise of the car use has polluted the air.
- Gradual
Meaning: Step by step, slow but continuous, uniform, successive, progressive, steady, regular, even, consistent.
Example: The participation of women in these sectors gradually improved and in 2015, more than 38% women were employed in these job sectors.
Example: The participation of women in these sectors gradually improved and in 2015, more than 38% women were employed in these job sectors.
- Decline
Meaning: Reduce, decrease, plummet, plunge, slump, shrink, fall off, lessen.
Example: Investment in clean energy declined in the third world countries in 2005 while it actually doubled in most of the first world countries.
Example: Investment in clean energy declined in the third world countries in 2005 while it actually doubled in most of the first world countries.
- An upward trend
Meaning: The tendency of being higher, something that goes upward.
Example: An upward trend in the number of club members was visible from 2005 to 2007 after which it actually dropped.
Example: An upward trend in the number of club members was visible from 2005 to 2007 after which it actually dropped.
- Respectively
Meaning: Consecutively, sequentially.
Example: Car theft cases in Denmark, Sweden, UK and Japan were respectively240, 210, 354 and 189 in January 2018.
Example: Car theft cases in Denmark, Sweden, UK and Japan were respectively240, 210, 354 and 189 in January 2018.
- Consecutively
Meaning: Sequentially, progressively.
Example: While the daily fast food consumption per person in the UK was 50 grams, it was 61, 32 and 25 grams in the USA, Sweden and China consecutively.
Example: While the daily fast food consumption per person in the UK was 50 grams, it was 61, 32 and 25 grams in the USA, Sweden and China consecutively.
- Apex
Meaning: The highest point, peak, vertex, pinnacle, summit, top.
Example: The price then increased noticeably and reached the apex in 2017.
Example: The price then increased noticeably and reached the apex in 2017.
- Acclivity
Meaning: Ascent, climb, rise.
Example: The activity of the car ownership in Europe further developed and reached to 57% in 2011.
Example: The activity of the car ownership in Europe further developed and reached to 57% in 2011.
- Declivity
Meaning: A downward slope, decline, decrease.
Example: The declivity on the number of female members in 2011 was almost double than that of the previous year.
Example: The declivity on the number of female members in 2011 was almost double than that of the previous year.
- Remained stable
Meaning: Remained constant, did not change.
Example: The ratio of highly skilled professionals in the former country increased significantly but remained stable in the later one.
Example: The ratio of highly skilled professionals in the former country increased significantly but remained stable in the later one.
- Plummet
Meaning: Plunge, fall, decline, slump, nosedive, drop, decrease.
Example: The ratio of unemployed youth, who have vocational education, plummeted in 2005 than that of two years earlier.
Example: The ratio of unemployed youth, who have vocational education, plummeted in 2005 than that of two years earlier.
- Prevalent
Meaning: Common, general, usual, prevailing, widespread, endemic, rampant.
Example: The prevalence of the trend could be better understood if we compare the data with that of the last twenty years.
Example: The prevalence of the trend could be better understood if we compare the data with that of the last twenty years.
- Stood at
Meaning: To remain stable/ intact, to come to a stop.
Example: The old hospital stood at the same position as it was five decades earlier but the free-space in front of it was converted to a car parking area.
Example: The old hospital stood at the same position as it was five decades earlier but the free-space in front of it was converted to a car parking area.
- Enumerate
Meaning: Identify, itemise, list, summarise, recite, specify, quote, relate.
Example: The illustration enumerates how Australian Bureau of Meteorology collects up-to-the-minute information on the weather.
Example: The illustration enumerates how Australian Bureau of Meteorology collects up-to-the-minute information on the weather.
- Radically
Meaning: Completely, hurriedly, abruptly.
Example: The technological advancement has radically changed the way employees used to work in their offices.
Example: The technological advancement has radically changed the way employees used to work in their offices.
- Positive development
Meaning: Improvement, progress, stay forward, increase, grow, rise.
Example: The increasing number of female executives in the company is considered a positive development.
Example: The increasing number of female executives in the company is considered a positive development.
- Subsequent
Meaning: Following, next, successive, succeeding.
Example: Despite a hike at the beginning of the year, the oil price steadily declined in the subsequent months until June 2017.
Example: Despite a hike at the beginning of the year, the oil price steadily declined in the subsequent months until June 2017.
- Commence
Meaning: Start, begin, set in motion, open, initiate, inauguarate.
Example: The construction of the road was commenced at the beginning of 2001 and ended in 2003.
Example: The construction of the road was commenced at the beginning of 2001 and ended in 2003.
- Plunge
Meaning: Slump, plummet, shrink, fall off, decline, decrease, drop, reduce.
Example: Employers' contribution to the fee for skill development courses has plunged to a great extent in the last decade, as the graph suggests.
Example: Employers' contribution to the fee for skill development courses has plunged to a great extent in the last decade, as the graph suggests.
- Surge
Meaning: Increase, went higher, jump.
Example: Duration of watching TV as a leisure activity surged among the elder people in Australia after 1998.
Example: Duration of watching TV as a leisure activity surged among the elder people in Australia after 1998.
- To dive
Meaning: Fall, descent, plummet, plunge, nosedive, drop.
Example: Consumption of word resources in some Asian countries, on the contrary, has dived after 2014.
Example: Consumption of word resources in some Asian countries, on the contrary, has dived after 2014.
- Abrupt
Meaning: Swift, sudden, instantaneous, hurried, startling, unanticipated, unexpected, rapid, speedy.
Example: The abrupt rise of the population in the early 21st century is contrasting to that of the beginning of the 18th century, as the data suggests.
Example: The abrupt rise of the population in the early 21st century is contrasting to that of the beginning of the 18th century, as the data suggests.
- Relative
Meaning: Correlative, corresponding, parallel, reciprocal.
Example: The academic performance and professional efficiency are somewhat relative to each other despite the presence of many other variables, according to the survey outcome.
Example: The academic performance and professional efficiency are somewhat relative to each other despite the presence of many other variables, according to the survey outcome.
- Modest
Meaning: Tolerable, adequate, moderate, fair, satisfactory, acceptable.
Example: The wheat export then witnessed a modest decline and it affected the revenue earned in 2015.
Example: The wheat export then witnessed a modest decline and it affected the revenue earned in 2015.
- Variation
Meaning: Disparity, inequality, dissimilarity, difference, variety, diversification.
Example: It can be inferred from the given data that variations in the pH values are sometimes detrimental.
Example: It can be inferred from the given data that variations in the pH values are sometimes detrimental.
- Elucidate
Meaning: Explain, make clear, clarify, throw/shed light on, explicate, annotate.
Example: The line chart elucidates how much waste was recycled in the UK between 1990 and 2015.
Example: The line chart elucidates how much waste was recycled in the UK between 1990 and 2015.
- Unravel
Meaning: Untangle, clear up, disentangle, explain, straighten out, separate out.
Example: The data unravel the fact that the crime rate increases in the later decades despite some stringent initiatives from the law-enforcers.
Example: The data unravel the fact that the crime rate increases in the later decades despite some stringent initiatives from the law-enforcers.
»» Make sure you know all of these words/ phrases and can use them while writing a report/ describing a graph.